
As we noted in our 2020 Investment Insights report, the economic path remains shrouded in a dense fog. With the Delta variant of COVID-19 now making up more than 50%1 of cases, masks mandates, further shutdowns, and work-from-home implementations may either continue or be reinstituted by federal or local authorities.
However, consistent with our core values here at SFG, we remain confident in our convictions and in our tools for addressing risk mitigation and scenario planning. One of the main scenarios that our investment team is currently watching very closely is inflation and how we can help protect against it within our portfolio allocations. The goal is to put our clients in the best position to take advantage of any potential opportunities that may arise when the fog lifts and economic outlooks become clearer.
2021 Mid-Year Overview
The federal government continued its stimulus program by issuing a third payment to much of the American population. Additionally, parents have begun to collect their Child Tax credit in the form of monthly payments. Fueled by all this direct support to consumers, the S&P 500 has climbed over 15% for the year as of June 30, 2021.2 Over the same period, the Barclay’s AGG (the benchmark for investment-grade fixed income), has fallen -1.6%2 due to inflation concerns and expectations. We will address these inflation concerns at length later in this paper.
As we noted last year, consumer preferences are changing rapidly. Many employees want to continue working from home, and it appears that many companies are complying by transitioning to a hybrid model combining home and office work. We also saw demand in the online grocery market skyrocket during the pandemic, and the data show3 that most active users have continued and even grown their order count year over year. We believe these changes in consumption and work preferences will continue to evolve.
Is the Monetary Policy Road on Track for Persistent Inflation?
Updating our discussion on “Which Monetary Policy Road Are We On,” it seems that we are traveling down the center lane. At some point, we need to move back to the Monetarism lane before we have a major socio-economic accident in the center lane or wrong lane (MMT). The MMT side means continuing to grow the Money Supply and suppress interest rates.
Figure 1: Money Stock
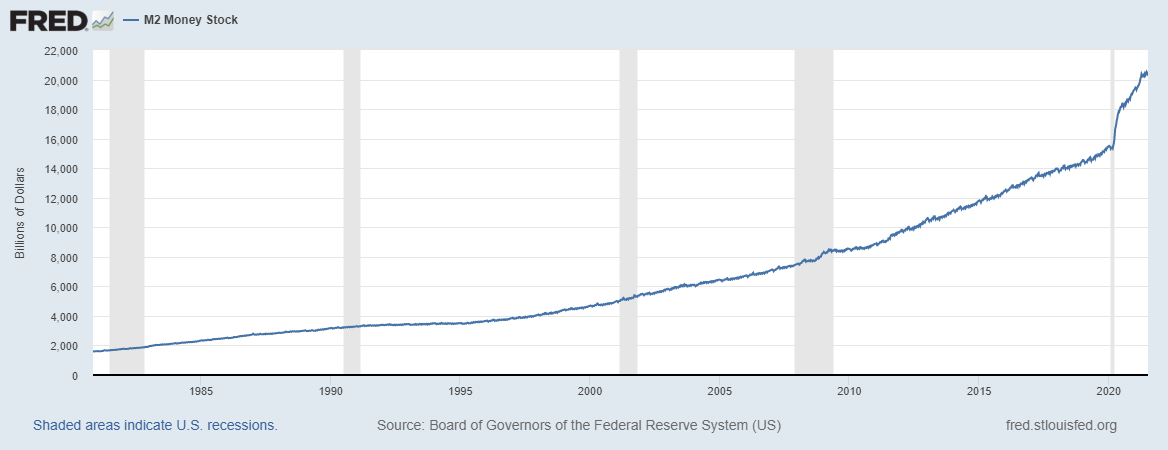
Citation: Board of Governors of the Federal Reserve System (US), M2 Money Stock [WM2NS], retrieved from FRED, Federal Reserve Bank of St. Louis; https://fred.stlouisfed.org/series/WM2NS, August 4, 2021.
Figure 2: Interest Rates, Discount Rate for United States
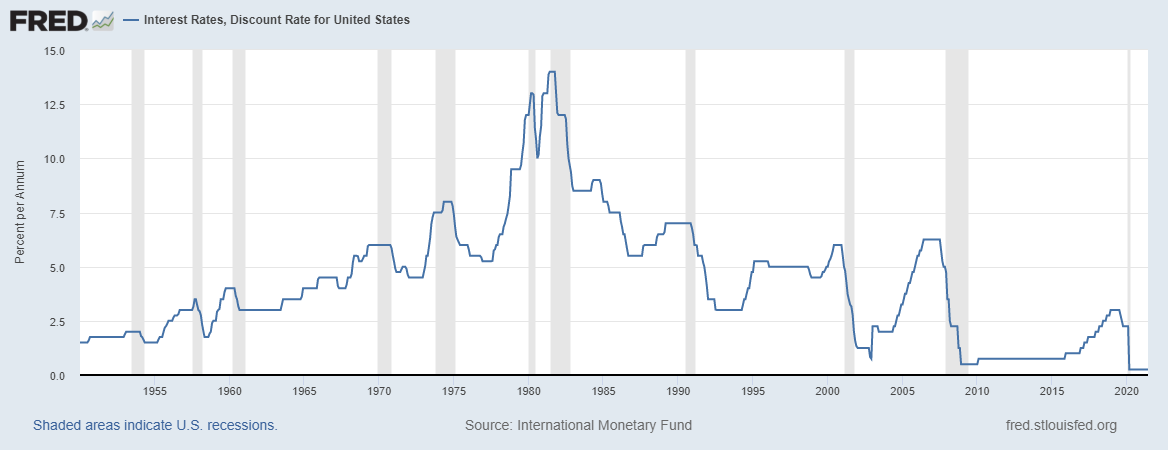
Citation: International Monetary Fund, Interest Rates, Discount Rate for United States [INTDSRUSM193N], retrieved from FRED, Federal Reserve Bank of St. Louis; https://fred.stlouisfed.org/series/INTDSRUSM193N, August 4, 2021.
Inflation has spiked due to the pandemic’s disruption of supply chains and the pent-up demand for certain goods and services. Commodities like lumber soared to over $1,500 per thousand board feet before coming back down to around $600. (See Figure 3)
Figure 3: Lumber (LBS) $606.50; -29.10 (-4.58%); DATA AS OF AUG 03, 2021 5:15 PM ET
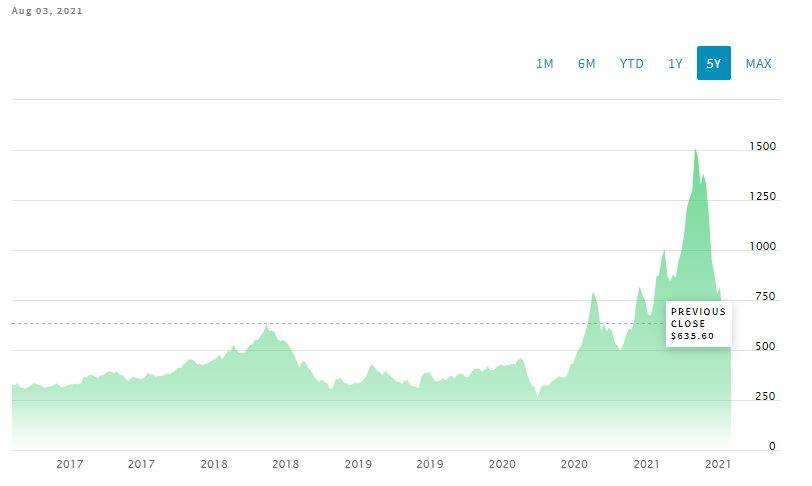
Source: Lumber Price: Latest Futures Prices, Charts & Market News | Nasdaq
Once the supply/demand imbalances are resolved, inflation could return to pre-pandemic levels. On the other hand, several factors could conspire to cause inflation to persist for a long period at 4-5%, instead of the Fed’s 2% target. We may also see a low growth environment of 2% +/- due to the amount of debt being created. See figures below.
Figure 4: Gross Federal Debt as Percent of Gross Domestic Product
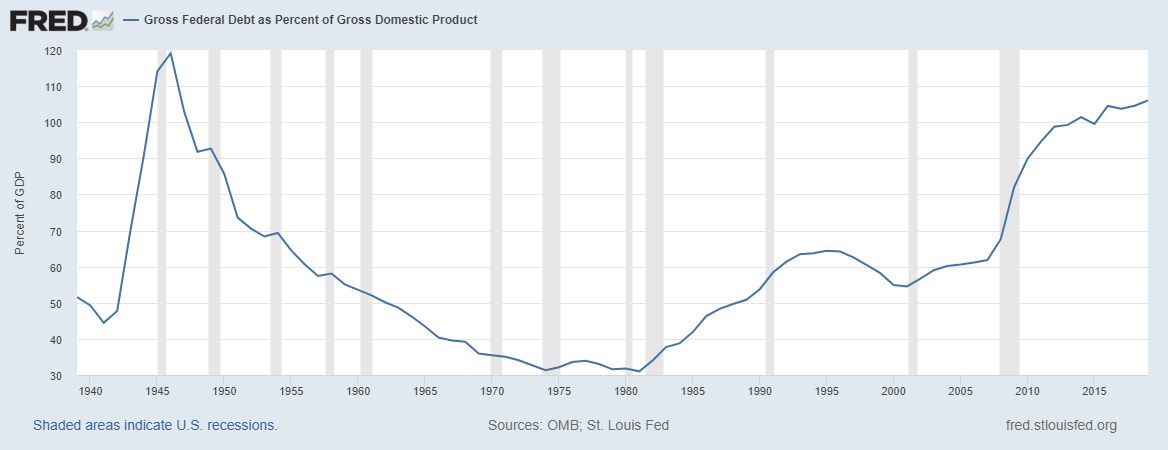
Citation: U.S. Office of Management and Budget and Federal Reserve Bank of St. Louis, Gross Federal Debt as Percent of Gross Domestic Product [GFDGDPA188S], retrieved from FRED, Federal Reserve Bank of St. Louis; https://fred.stlouisfed.org/series/GFDGDPA188S, August 4, 2021.
Figure 5: Federal Debt: Total Public Debt as Percent of Gross Domestic Product
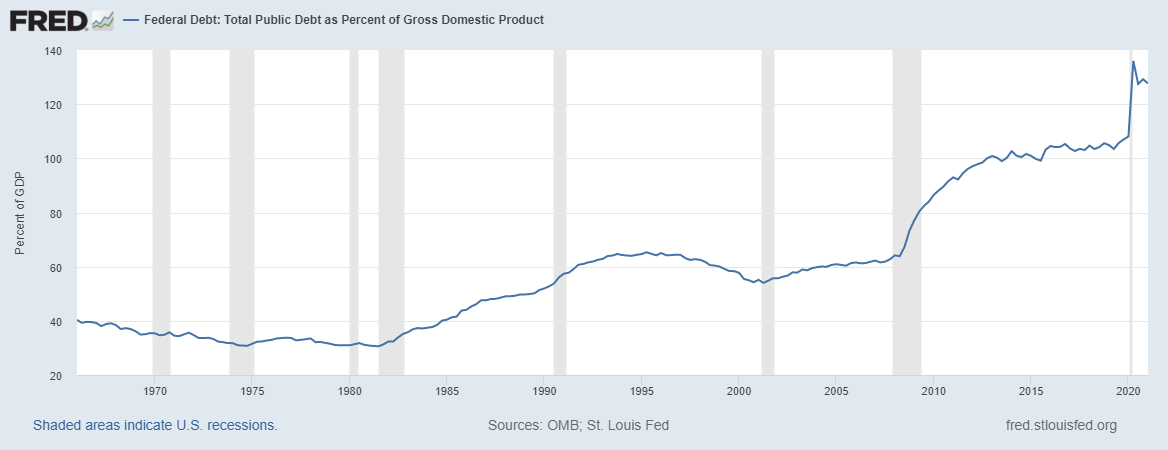
Citation: U.S. Office of Management and Budget and Federal Reserve Bank of St. Louis, Federal Debt: Total Public Debt as Percent of Gross Domestic Product [GFDEGDQ188S], retrieved from FRED, Federal Reserve Bank of St. Louis; https://fred.stlouisfed.org/series/GFDEGDQ188S, August 4, 2021.
The following factors influence inflation:
- Current policies of excessive Money Supply growth and rising federal deficits could cause private sector and government demand for goods and services to outpace supply, leading to higher prices.
- Consumers increasingly spend the cash they have built up and banks boost lending, which would increase the velocity of money from its current level of 1.2 to its baseline ratio of 1.8 or higher.4 See our prior discussion, “Which Monetary Policy Road Are We On.”
- The shortage of workers and increase in minimum wages lead to higher wage costs.
- A demographic shift to more unproductive than productive people, driven by the growing elderly population and declining birth rate, results in higher costs.
- Slowing globalization, or deglobalization, due to the pandemic’s disruption of supply chains would raise prices.
- Global warming disasters and measures being taken to prevent them are increasing costs, with no rise in productivity to offset those direct costs.
- Higher expenses from cybersecurity measures are also a direct cost with no corresponding increase in productivity.
- Dollar depreciation results in higher prices for imported goods and services.
- Inflation expectations among firms and workers can have a future effect on the price of goods and services as well as wages.
- Digitalization of the economy is a major factor in reducing inflation by improving productivity.
How the combination of all these factors plays out will determine the long-term outcome for higher persistent inflation. Monetary and Fiscal policies will affect some of the factors to accelerate, stabilize, or reduce inflation.
Possibility of Stagflation?
Stagflation is also being discussed. Stagflation is defined as persistently high inflation, combined with a high unemployment rate and stagnant demand in the economy. Given today’s low unemployment, we currently do not see this happening. After pandemic-related supply chain disruptions stabilize, we anticipate more of an inflation in a slow growth economy scenario, unless a Black Swan event occurs.
Currently, our base case scenario is that inflation begins to taper down from 5% to around 2% for a period and then increases to a persistent level of 4-5%, based on the above factors materializing.
Hedging Against Inflation
Investments we are considering for the inflation-protection portion of our clients’ portfolios include Treasury Inflation-Protected Securities (TIPS), commodities, gold, equities able to pass on increased costs, and real estate.
We will be expanding on the inflation factors and inflation-protection investments in future articles.
Interested in more information related to investment management? Click here or contact us at 775-850-5620.
Schultz Financial Group Inc. (SFG) is a wealth management firm located in Reno, NV. Our approach to wealth management is different from many other wealth managers, financial advisors, and financial planners. Our team of fee-only fiduciaries strives to help our clients build their wealth across four capitals: Financial Matters, Physical Well-being, Psychological Space, and Intellectual Engagement. We provide family office and wealth management services to clients located in Nevada, California, and other states. If you’d like more information, please check out our website or reach out to us via our contact page.
- What Makes the Delta Variant of Covid-19 So Dangerous for Unvaccinated People – WSJ
- Morningstar Data
- Online grocery sales exceed $8 billion again in November (supermarketnews.com)
- Velocity of M2 Money Stock (M2V) | FRED | St. Louis Fed (stlouisfed.org)