
In our 2021 article entitled Is the Monetary Policy Road on Track for Persistent Inflation?, we noted that America was in the middle of the road between “Monetarism” and “Modern Monetary Theory.” Since then, our view is the country has moved into the Modern Monetary Theory lane and is now trying to shift back toward Monetarism as inflation has increased. (Economist Paul Kasriel wrote an entertaining piece explaining how we got the inflation.)
No Free Lunch: Why Are We Experiencing Inflation?
In my early years of education and business, I saw economist Milton Friedman speak and read some of his books. One of his books was titled THERE’S NO SUCH THING AS A FREE LUNCH, and we feel that title rings true today. One of his notable quotes is:
“Government has three primary functions. It should provide for military defense of the nation. It should enforce contracts between individuals. It should protect citizens from crimes against themselves or their property. When government—in pursuit of good intentions—tries to rearrange the economy, legislate morality, or help special interests, the cost comes in inefficiency, lack of motivation, and loss of freedom. Government should be a referee, not an active player.”
Figure 1 shows how the federal debt has soared in recent years. The government simply can’t give out trillions and have the Federal Reserve (Fed) fund it without creating inflation, especially while supply is constrained by the pandemic and global supply chain disruptions.
Figure 1: Federal Debt: Total Public Debt
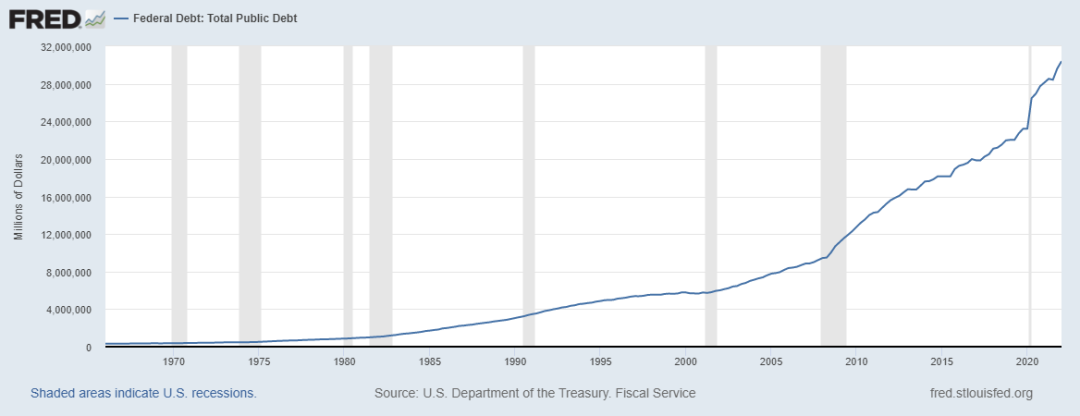
Citation: U.S. Department of the Treasury. Fiscal Service, Federal Debt: Total Public Debt [GFDEBTN], retrieved from FRED, Federal Reserve Bank of St. Louis; https://fred.stlouisfed.org/series/GFDEBTN, July 14, 2022.
The Fed has been creating money out of thin air as it absorbed Treasuries. Let’s refer back to Monetarism’s equation of MV=PQ. Money Supply (M) has spiked higher (as represented by Figure 2) while Velocity of Money (V) stays constant. In response, Price Level (P) has increased as Quantity of Goods and Services (Q) declined.
Figure 2: M2
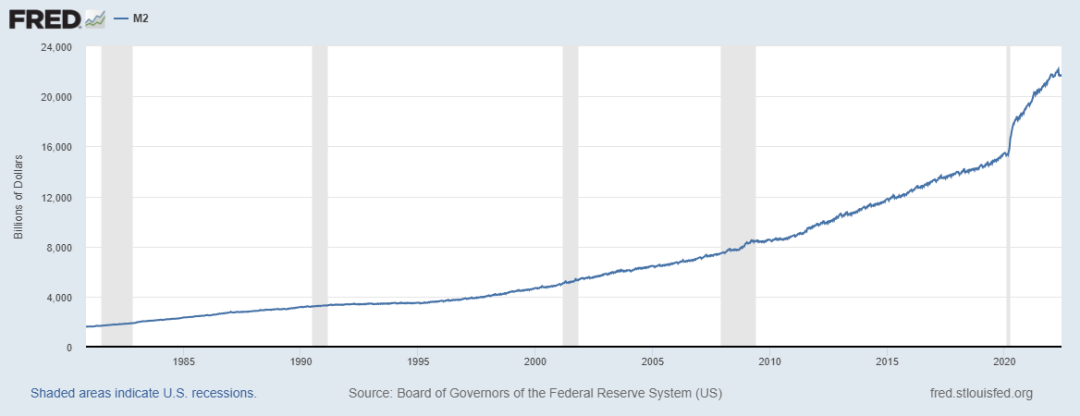
Notes: Before May 2020, M2 consists of M1 plus (1) savings deposits (including money market deposit accounts); (2) small-denomination time deposits (time deposits in amounts of less than $100,000) less individual retirement account (IRA) and Keogh balances at depository institutions; and (3) balances in retail money market funds (MMFs) less IRA and Keogh balances at MMFs.
Beginning May 2020, M2 consists of M1 plus (1) small-denomination time deposits (time deposits in amounts of less than $100,000) less IRA and Keogh balances at depository institutions; and (2) balances in retail MMFs less IRA and Keogh balances at MMFs. Seasonally adjusted M2 is constructed by summing savings deposits (before May 2020), small-denomination time deposits, and retail MMFs, each seasonally adjusted separately, and adding this result to seasonally adjusted M1.
For more information on the H.6 release changes and the regulatory amendment that led to the creation of the other liquid deposits component and its inclusion in the M1 monetary aggregate, see the H.6 announcements and Technical Q&As posted on December 17, 2020.
Citation: Board of Governors of the Federal Reserve System (US), M2 [WM2NS], retrieved from FRED, Federal Reserve Bank of St. Louis; https://fred.stlouisfed.org/series/WM2NS, July 14, 2022.
Putting the Brakes on Inflation: How Does the Fed Fight Inflation?
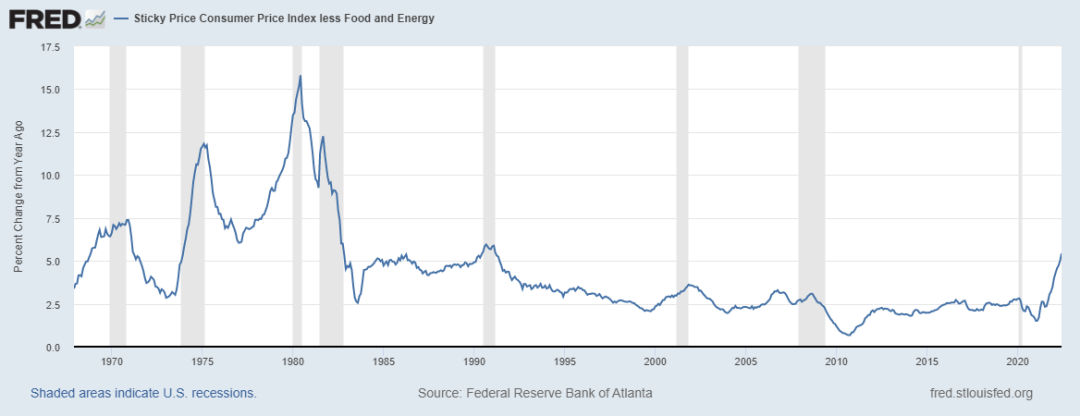
The past few years have brought a perfect storm of Fed policy change, Covid-19, the Ukraine/Russia war, Middle East tensions, excessive government spending, supply chain disruptions, and deglobalization. All these events have contributed to the asset inflation and goods/services inflation we are currently experiencing (see Figures 3 and 4).
Figure 3: Stick Price Consumer Price Index Less Food and Energy
Notes: The Sticky Price Consumer Price Index (CPI) is calculated from a subset of goods and services included in the CPI that change price relatively infrequently. Because these goods and services change price relatively infrequently, they are thought to incorporate expectations about future inflation to a greater degree than prices that change on a more frequent basis. One possible explanation for sticky prices could be the costs firms incur when changing price.
To obtain more information about this release see: Michael F. Bryan, and Brent H. Meyer. “Are Some Prices in the CPI More Forward Looking Than Others? We Think So.” Economic Commentary (Federal Reserve Bank of Cleveland) (May 19, 2010): 1–6. https://doi.org/10.26509/frbc-ec-201002.
Citation: Federal Reserve Bank of Atlanta, Sticky Price Consumer Price Index less Food and Energy [CORESTICKM159SFRBATL], retrieved from FRED, Federal Reserve Bank of St. Louis; https://fred.stlouisfed.org/series/CORESTICKM159SFRBATL, July 14, 2022.
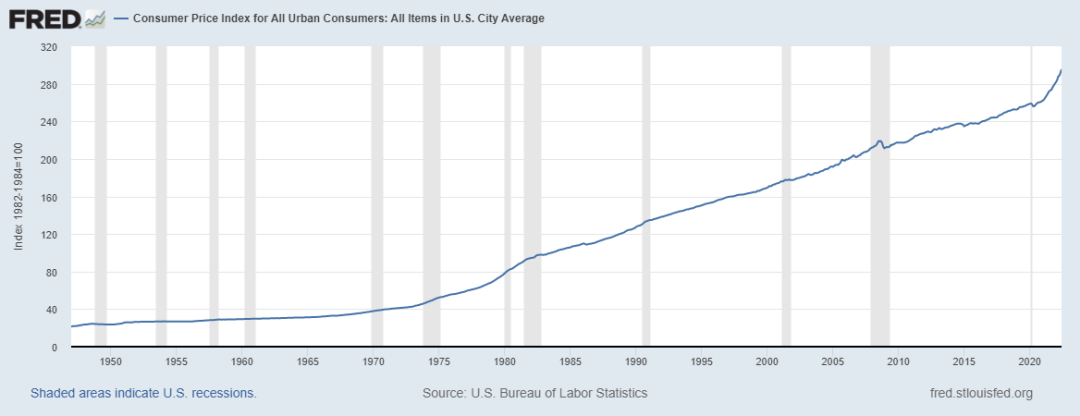
Figure 4: Consumer Price Index for All Urban Consumers: All Items in U.S. City Average
Notes: The Consumer Price Index for All Urban Consumers: All Items (CPIAUCSL) is a price index of a basket of goods and services paid by urban consumers. Percent changes in the price index measure the inflation rate between any two time periods. The most common inflation metric is the percent change from one year ago. It can also represent the buying habits of urban consumers. This particular index includes roughly 88 percent of the total population, accounting for wage earners, clerical workers, technical workers, self-employed, short-term workers, unemployed, retirees, and those not in the labor force.
The CPIs are based on prices for food, clothing, shelter, and fuels; transportation fares; service fees (e.g., water and sewer service); and sales taxes. Prices are collected monthly from about 4,000 housing units and approximately 26,000 retail establishments across 87 urban areas. To calculate the index, price changes are averaged with weights representing their importance in the spending of the particular group. The index measures price changes (as a percent change) from a predetermined reference date. In addition to the original unadjusted index distributed, the Bureau of Labor Statistics also releases a seasonally adjusted index. The unadjusted series reflects all factors that may influence a change in prices. However, it can be very useful to look at the seasonally adjusted CPI, which removes the effects of seasonal changes, such as weather, school year, production cycles, and holidays.
The CPI can be used to recognize periods of inflation and deflation. Significant increases in the CPI within a short time frame might indicate a period of inflation, and significant decreases in CPI within a short time frame might indicate a period of deflation. However, because the CPI includes volatile food and oil prices, it might not be a reliable measure of inflationary and deflationary periods. For a more accurate detection, the core CPI (CPILFESL) is often used. When using the CPI, please note that it is not applicable to all consumers and should not be used to determine relative living costs. Additionally, the CPI is a statistical measure vulnerable to sampling error since it is based on a sample of prices and not the complete average.
For more information on the consumer price indexes, see:
Bureau of Economic Analysis. “CPI Detailed Report.” 2013.
Handbook of Methods
Understanding the CPI: Frequently Asked Questions
Citation: U.S. Bureau of Labor Statistics, Consumer Price Index for All Urban Consumers: All Items in U.S. City Average [CPIAUCSL], retrieved from FRED, Federal Reserve Bank of St. Louis; https://fred.stlouisfed.org/series/CPIAUCSL, July 14, 2022.
To bring inflation under control, the Fed has started increasing the Fed Funds rate and stopped suppressing long-term rates by buying Treasuries. Quantitative Easing is out and Quantitative Tightening is in, which means the Fed allows the bonds it bought to mature without reinvesting the proceeds, removing those dollars from the system. In June 2022, the Fed started removing $30 billion in Treasury securities and $17.5 billion in agency mortgage-backed securities from its balance sheet each month.1 Those dollar amounts will double to $60 billion and $35 billion beginning in September. 2
If the Fed stays the course in increasing interest rates and draining liquidity, we expect assets to reprice and demand to decline, which should reduce goods/services inflation. To get back to 2-3% inflation, we would have to see oil prices down to $60-$70 per barrel and natural gas at $3-$4 per thousand cubic feet. Fed policy does not directly impact energy prices. Reducing demand would have an effect, but supply needs to increase to reduce price. Our base-case scenario remains slowing economic growth, maybe to the point of recession, and declining-but-still- elevated inflation until the perfect storm subsides.
Investment Impacts and Opportunities as a Result of Inflation
How would asset repricing affect investors? Here are some of our thoughts as we review our clients’ portfolios during current market volatility:
-
Equities – The degree of price declines so far has depended on how overvalued the equities were in the first place. An economic slowdown could bring an earnings contraction, which will be the next phase in asset repricing. This phase might overshoot as it has in the past, before the rebuild begins.
-
Fixed Income – Asset values have adjusted based on their duration, with longer-term securities falling the most as interest rates rise. Will credit risk be the next market mover? The answer depends on how much the economy slows.
-
Hedge Funds – This category may perform better in volatile markets because of the opportunity to find price discovery. Hedge funds must be assessed on a case-by-case basis because strategies and managers can vary widely.
-
Alternative Fixed Income Trading Strategies – These strategies may perform better in today’s markets by sidestepping the downside and reentering at a later point to capture upside.
-
Commercial Real Estate – Values could decline depending on if and how much cap rates increase. Economic growth, property type, tenant credit, and geographic location are other variables affecting prices. Housing is just beginning to show signs of a slowdown, with some prices falling amid higher interest rates. Going forward, we expect price reductions will vary based on how much values increased over the past 18 months and where properties are located.
-
Private Credit – Private credit in middle market lending and venture debt could present opportunities during an asset repricing. Most of this debt is floating and adjusts as interest rates increase. Opportunistic Credit may perform better depending on liquidity and the economic landscape. If the economy slows, credit becomes the critical area to assess.
-
Private Equity – With valuations declining and liquidity drying up, this could be another area of opportunity.
It’s important to remember that investing is a long-term process, not an event. At Schultz Financial Group, we use scenario planning to determine how various inputs can affect investment strategies. We then utilize our due diligence process to better understand managers and how they are executing in the current environment.
It’s part of our commitment to deliver solutions based on each client’s unique liquidity needs, tolerance for volatility, risk of permanent capital loss, time horizon for different life stages, and philanthropic plans – to name just a few. The result is a custom portfolio of public and private investments designed to put financial capital to work toward their goals.
If you have any questions or would like a more in-depth discussion, please contact us.
1 & 2 Down the Drain – The Last Bear Standing (substack.com)
This blog is presented by Schultz Financial Group, Inc. (“SFG”) which is a registered investment adviser. Registration as an investment adviser is not an endorsement by securities regulators and does not imply that SFG has attained a certain level of skill, training, or ability. While SFG believes the content is factual and up to date, it is based on information obtained from a variety of sources that has not necessarily been independently verified, and it should not be regarded as a complete analysis of the subjects discussed. All expressions of opinion reflect the judgment of SFG as of the date of publication and are subject to change. This does not constitute personalized advice from SFG or its affiliated investment professionals, or a solicitation to execute specific securities transactions. SFG is not a law firm and does not intend for any content to be construed as legal advice. Readers should not use any of this content as the sole basis for any investment, financial planning, tax, legal or other decisions. Rather, SFG recommends that readers consult professional advisers (including their financial professionals, lawyers, and accountants) and consider independent due diligence before implementing any of the options directly or indirectly referenced. Past performance does not guarantee future results. All investment strategies have the potential for profit or loss, and different investments and types of investments involve varying degrees of risk. There can be no assurance that the future performance of any specific investment or investment strategy, including those undertaken or recommended by SFG, will be profitable or equal any historical performance level. The index performance data directly or indirectly referenced is based on data from the respective copyright holders, trademark holders, or publication/distribution right owners of each index. The index performance does not reflect the deduction of transaction fees, custodial charges, or management fees, which would decrease historical performance results. Indexes are unmanaged, and investors cannot invest directly in an index. Not all SFG’s services will be appropriate or necessary for all clients, and the potential value and benefit of SFG’s services will vary based upon the client’s individual investment, financial, and tax circumstances. The effectiveness and potential success of a tax strategy, investment strategy, and financial plan depends on a variety of factors, including but not limited to the manner and timing of implementation, coordination with the client and the client’s other engaged professionals, and market conditions. Additional information about SFG, including its Form ADV Part 2A describing its services, fees, and applicable conflicts of interest and Form CRS is available upon request and at https://adviserinfo.sec.gov/firm/summary/108724.